My goal for each of these “deep dive” pieces is to explore individual freight transportation companies within the context of their sector, with a particular emphasis on the relevant fundamental drivers. I chose to start with Old Dominion as it is one of the best-run businesses in the entire freight transportation industry with attractive financial metrics and a solid (and widening) competitive advantage.

Let’s start with the broader industry overview. Trucking broadly is the backbone of the U.S.’s domestic supply chain, and accounts for ~80% of U.S. transportation spend. Most of the spend is on truckload (“TL”, each customer gets their own truck) and less than 10% is spent on a niche called less-than-truckload (“LTL”, many customer’s shipments share a truck). However, the unit economics and industry structures are materially different:
TL is a point-to-point, high variable cost/low fixed cost business, and is very fragmented with 90% of industry capacity in trucking companies which operate 6 or fewer trucks.
LTL is a network, hub-and-spoke business, with material concentration among the largest companies (largest 5 companies account for about 55% of industry revenues).
The consequences of these difference are why LTLs generally have better economics than TLs:
Time to dig into Old Dominion Freight Lines (“$ODFL”). For a company with such a terrific track record (24% stock CAGR over ~16 years, 12% revenue CAGR over 17 years), it’s interesting that I haven’t seen much in-depth analysis written on it in the style of $FAST, $TDG, or a Malone/Buffett entity. It’s an ideal fit for Berkshire: capital intensive but excellent returns with a competitive advantage that has consistently expanded that still has a lot of growth opportunities ahead.
The simplest explanation for this outperformance is $ODFL is the best-in-class operator in the LTL space, with a premium offering with the best service and provides very reasonable value.
Mastio has named $ODFL the number 1 national LTL carrier for 11 straight years through 2020. Even with arguably the best value offering, $ODFL manages to achieve best-in-class operating margins. This is because LTL is a density business. To understand this, we need to study how the business operates.
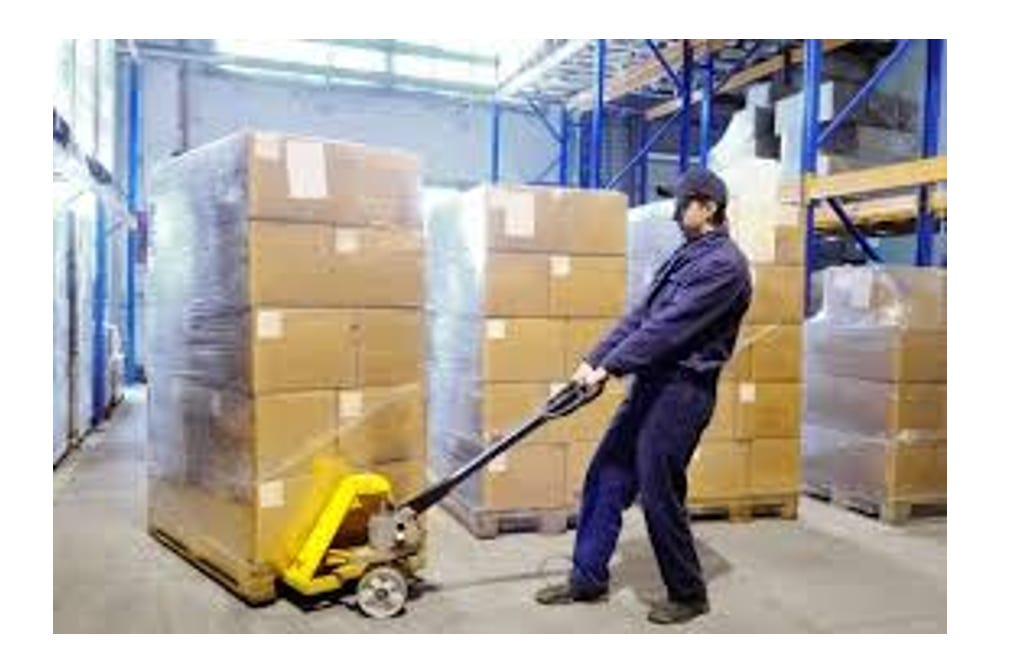
The typical LTL freight is 1,000-1,500 pound pallets, such as those carried by this fellow below. Each truck carries freight from multiple shippers, shipping to multiple destinations.

Each shipment moves through the LTL supply chain more or less following the schema below. It’s a hub-and-spoke business model and requires investment in real estate assets (“Service Centers” and “Hubs”) throughout the country. LTLs buy tractors and trailers for the consolidation (1 and 2), line haul (3), and final delivery components (4 and 5). Bear in mind that the delivery endpoint is still a business/warehouse typically as opposed to a consumer (unless the consumer is looking to buy a half ton of a single product…). It pays to be the big dog in this industry, $ODFL repeatedly emphasizes density is the key to this model as well as getting close to the end customer.
Let’s zoom in on “5,” and consider deliveries involving $ODFL’s Portland service center as a hypothetical example. Let’s assume for simplicity that there are 6 customers with shipments on a given day. If each delivery at a stop takes 10 minutes, that’s ~60 minutes stopping time and 90 minutes of delivery time for a total of 150 minutes, so about 25 minutes per delivery.

Now let’s explore what happens when we double deliveries in the local areas. Assuming that the original truck was full (generally there should be opportunities to squeeze one or more shipments with the same truck as well), we can split it into two truck routes. You can see that while stoppage time scales linearly with the additional shipments (to ~120 minutes) but both trucks are spending less time on the road vs. the original single truck (60 minutes and 80 minutes, respectively, vs. 90 minutes for the original truck). Now it takes about 22 minutes on average per delivery, or a total time savings of 13% (and 22% savings in time on the road).


As you can see, there are material cost efficiencies by increasing density. Moreover, as density increases more, further time savings are possible by adding additional service centers to get closer to the end customer (but of course needs to be balanced by the costs of opening and maintaining additional real estate). Putting the warehouse on the route of the second loop could save an additional 7 minutes.
So in summary:
The dynamics are similar on the pickup side (1), and there are also benefits from increasing load factors on the long-distance line-haul component as well (3) and likely some savings from optimization of real estate assets. Moreover, even the biggest of shippers cannot match $ODFL’s density across time and space specifically in the LTL space (Amazon spends $60B annually, but that is spread across many transportation modes as well as on warehouses), the excess economic value should disproportionately accrue to $ODFL.
Conveniently, we can analyze the impact of doubling revenues in real life: $ODFL revenue is more than double that of close comparable Saia (“$SAIA”). The difference in gross margins is about 13%, which coincidentally exactly matches the percentage time savings demonstrated in our Portland example.
Unsurprisingly, due to these factors, $ODFL has continually invested for growth. Volumes have increased by 7% CAGR over the last 10 years through 2019 (5.5% 10 years through 2020) achieved through a combination of general LTL industry growth as well as market share gains vs competitors. Moreover, this volume growth along with $ODFL’s emphasis on efficient operations have a secondary benefit of better performance in terms of both more on-time deliveries and lower cargo claims (shorter hauls mean less risk of damaging freight).
Finally, this ever-improving performance also allows $ODFL to increase prices above inflation, or about 4-5% on average. Combined with high single digit volume growth, $ODFL’s revenues have grown at 13%/year in the decade to 2019 before COVID put a dent on the growth trajectory (still 10% CAGR over 10 years through 2020).
In terms of competition, three of its competitors, $YELL, $FDX Freight, and $XPO (formerly Conway) are similarly sized or larger on a revenue basis:
$FDX is interesting as in theory they have even more scale than $ODFL, however $FDX’s operating metrics are fairly consistently worse and/or less efficient than $ODFL’s, especially with respect to operating margins. I’m still researching why there is a discrepancy and why it’s so large, but my best guess is that $ODFL is simply more focused on LTL because it’s 97% of their business vs. about 10% for $FDX.
$YELL (formerly $YRCW) struggled through the Great Recession and hasn’t really recovered since. It’s a union carrier and union carriers as a whole have seen share losses to non-union carriers. ($YELL has lost money on EBT basis in 7 of last 10 years).
$XPO is slightly larger by shipment count but slightly smaller by revenue (excluding its European operations). In many regards its operating performance is close to $ODFL but comes up short especially with respect to adjusted operating margins. Moreover, XPO’s revenue growth has also been mediocre, at <2% CAGR over 4 years through 2019.
The overall statistic that jumps out the most is that $ODFL’s revenue/shipment is materially higher than all of its similarly sized competitors, while revenue per shipment accounting for weight and length of haul actually shows $ODFL to be slightly cheaper because $ODFL’s weight per shipment is significantly higher than everyone else. I’d think the key KPI, though, should be revenue/shipment/length of haul, as that would drive most of the variable costs (driver time, fuel costs, vehicle depreciation, etc.) and indeed the operating margins seem to directionally scale with that KPI between $YELL, $XPO, and $ODFL.
It’s also very reassuring that $ODFL’s drivers are extremely happy with the company. Look at this forum post comparing them vs. $SAIA. Basically all the votes are for Old Dominion. Same thing on this board. So, flywheel:
So, summarizing how $ODFL’s offering and how they got to where they are today: they have a better service product that basically costs the same as their competitors but generates higher margins due to a persistent and growing cost advantage. While capital expenditure needs are quite high as they typically spend 15-20% of revenue/year on capex, returns on capital are still quite attractive (my estimates in Appendix suggest new Service Center build ROIC of ~14%, but overall return on investment is higher as expanding existing facilities has better returns). Moreover, the capex requirements also deters competition. Starting an LTL business from scratch is very difficult because:
You’d need shipment density to justify spending the capex on real estate but you need the real estate to get shippers to give you freight.
Even if you are willing to spend on the capex, it’s hard to build a new service center due to NIMBY ($ODFL worked for years to get the permits to build a new Chicago facility).
Even if you manage to build the facilities, most of the industry has mediocre operating margins and it’s a tough slog to get to scale (6% on average in 4Q:16 vs 15% for $ODFL).
Perhaps the best news for $ODFL is that while it has shown terrific historical growth, the future remains bright as they only have 10-13% market share across their markets:
Looking forward, e-commerce is currently the biggest opportunity for LTL carriers, particularly for high service, faster providers such as $ODFL which specialize in next day or second day delivery. In the words of CFO Adam Satterfield:
“[T]he e-commerce trends, I think it is a long-term tailwind for the industry just because the supply chain dynamics of how that freight just sort of moves through versus large distribution centers to store deliveries versus the smaller fulfillment centers. And it probably is more conducive to LTL quantity size shipments. And I think that you've seen probably the LTL market over recent years increase somewhat for that. And our retail-related business over the last 5 years has increased as well a little bit faster than the company average, because in many cases, they're pushing for higher service carriers. And obviously, that's something that we can easily serve our customers with, being the best service provider in the space.” -Wolfe Research May 2020 Conference, transcript from TIKR.com
Amazon, which I suspect is $ODFL’s biggest customer (4.7% of revenues in 2020, up from 4.2% of revenues in 2019 and 4.0% in 2018), has opened roughly 175 new warehouses in 2020. The other side of the coin is that $ODFL’s legacy industrial business, which is 55-60% of the business, struggled early during the COVID lockdowns. If e-commerce business sticks post-COVID as some expect it does and industrial returns to normal, we could see some really strong y/y revenue growth as soon as this year.
$ODFL’s financial report card is impressive. Net income has compounded at a 24% CAGR over the past 10 years. Net debt was $265M in 2010, and has swung nearly $800M to a $525M net cash position in 2020. Diluted share count has dropped from 126M shares to 117M. All the growth is organic, there have been no acquisitions since 2008. Gross margins, operating margins, and return on capital employed have all marched up and to the right. It also would seem that as density further increases, these metrics will further improve, so it appears that $ODFL can continue to compound earnings at 20%+ rates for the foreseeable future. While there exist businesses in the freight industry with gaudier financial metrics (asset-light or non-asset brokers and forwarders), $ODFL combines excellent financials with a strong and growing moat.
Not investment advice. Family members own shares in $ODFL.


Great post! Quick question, how do you know that legacy industrials is 55/60% of ODFL revenues?